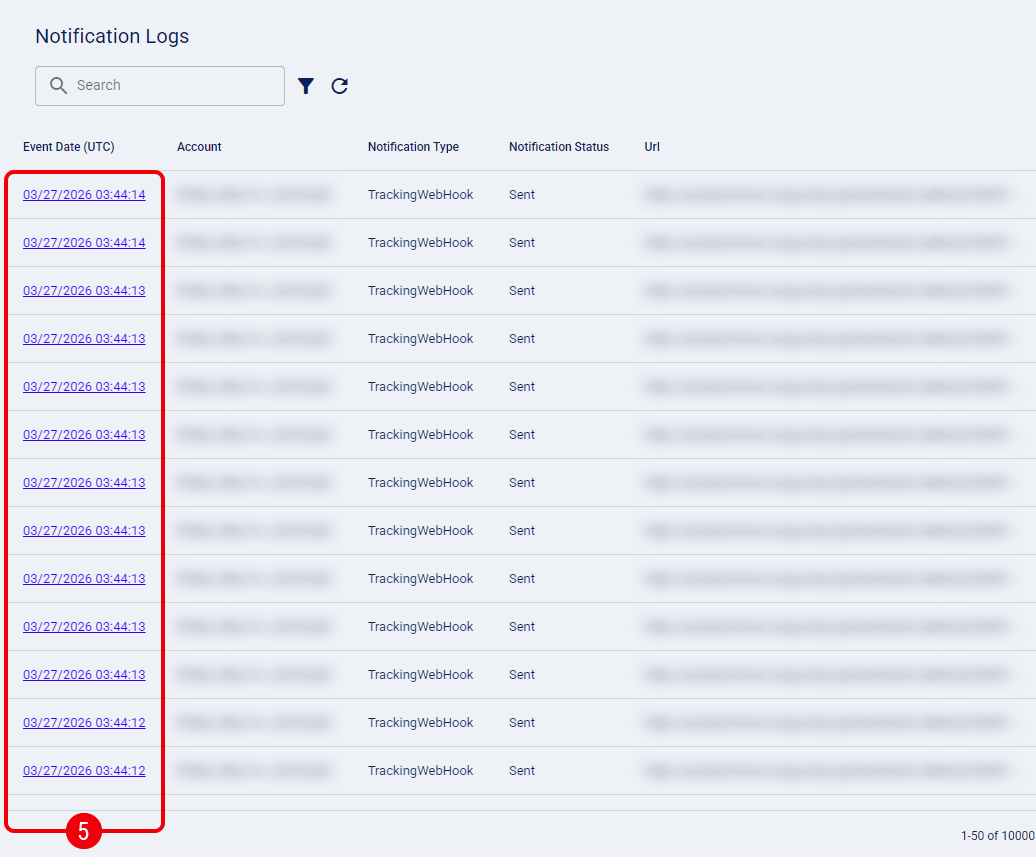
The Notification Logs record the status of all sent webhooks. Use this section to find and examine a specific entry for troubleshooting, testing, and debug analysis.
This guide covers how to access and filter the Notification Logs in techTRACK .
 | Click Notification Logs from the left menu under the Logs section. |
 | Filter the entries using the Search bar or click on the filter icon to open the Advanced Filter window. |

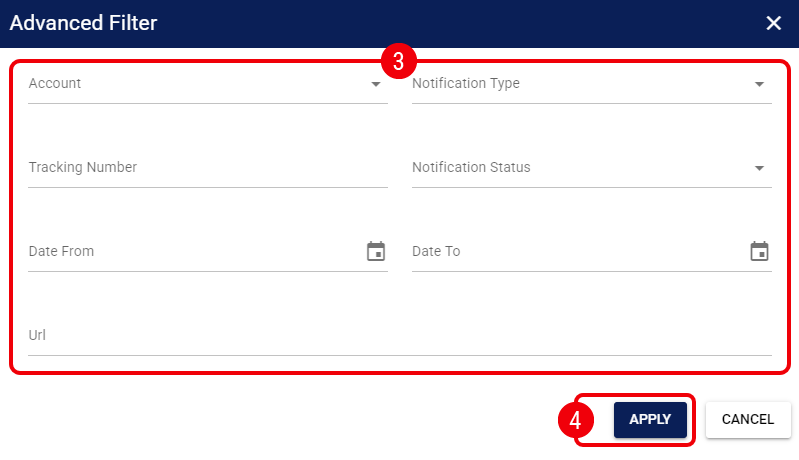
 | Modify any of the Advanced Filter fields to narrow down your results: |
- Account : Select an account from the drop-down to filter by the webhook's ownership.
- Notification Type : Select an option to filter by the specific webhook's type.
- Tracking Number : Enter a specific tracking identifier to locate related webhook events.
- Notification Status : Select a status from the drop-down to filter by the transmission result.
- Date From : Select the start date for your search range in UTC. This value is inclusive, meaning logs from this exact date are included in the results.
- Date To : Select the end date for your search range in UTC. This value is exclusive, meaning the results will only include logs up to, but not including, this date.
- Url : Enter the endpoint URL to filter logs directed to a specific destination.
 | Press Apply to review the filtered entries on the main grid. |
 | Click on the Event Date (UTC) hyperlink for the desired entry to view its detailed Request and Response data. |
You can now look for specific keywords or data points related to the case you are investigating within the JSON Response section.
